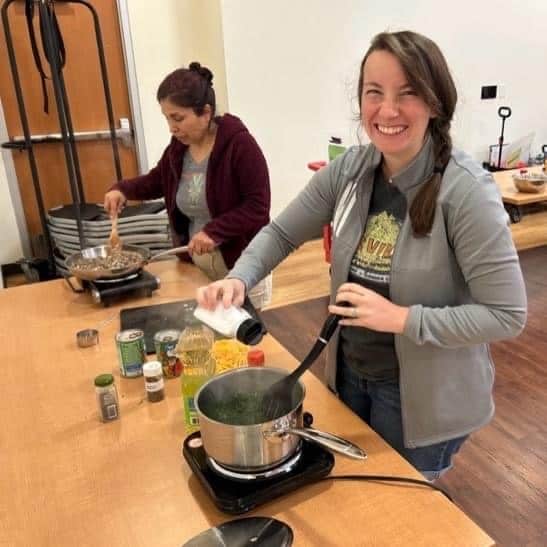
Gather your community for a culinary-nutrition experience. Together we will discuss healthful eating habits, shopping on a budget, and more while we prepare a recipe
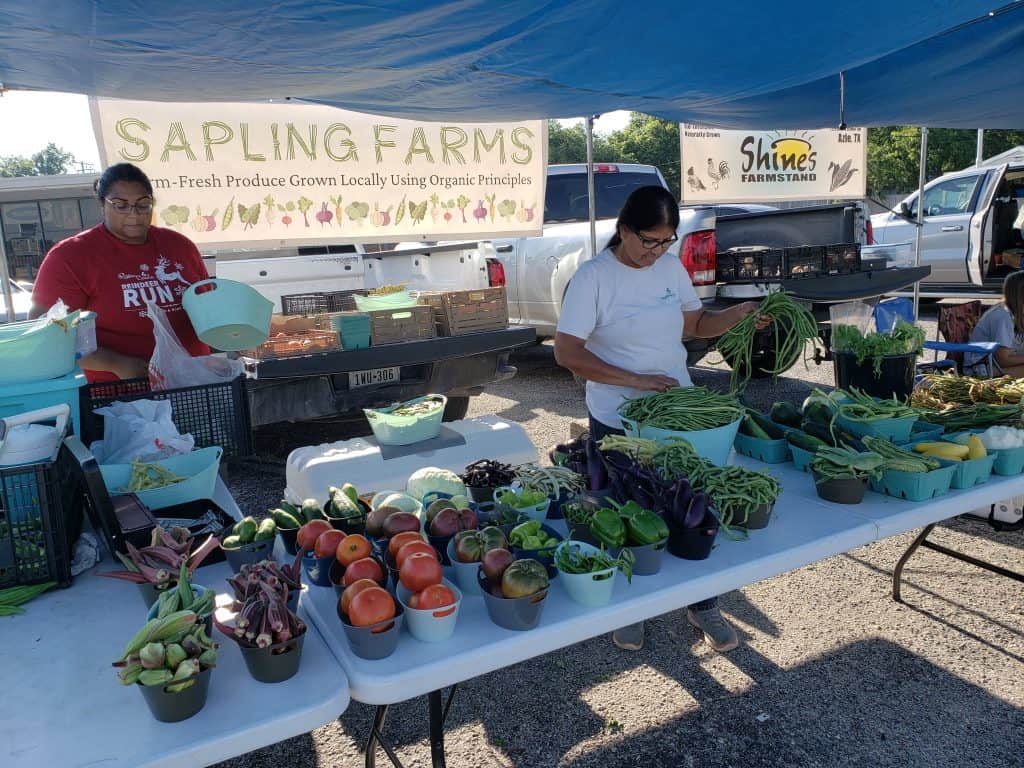
Farmers Market Nutrition Program
Provides fresh fruits and vegetables to local communities, enhancing fresh food access for clients on SNAP and WIC benefits
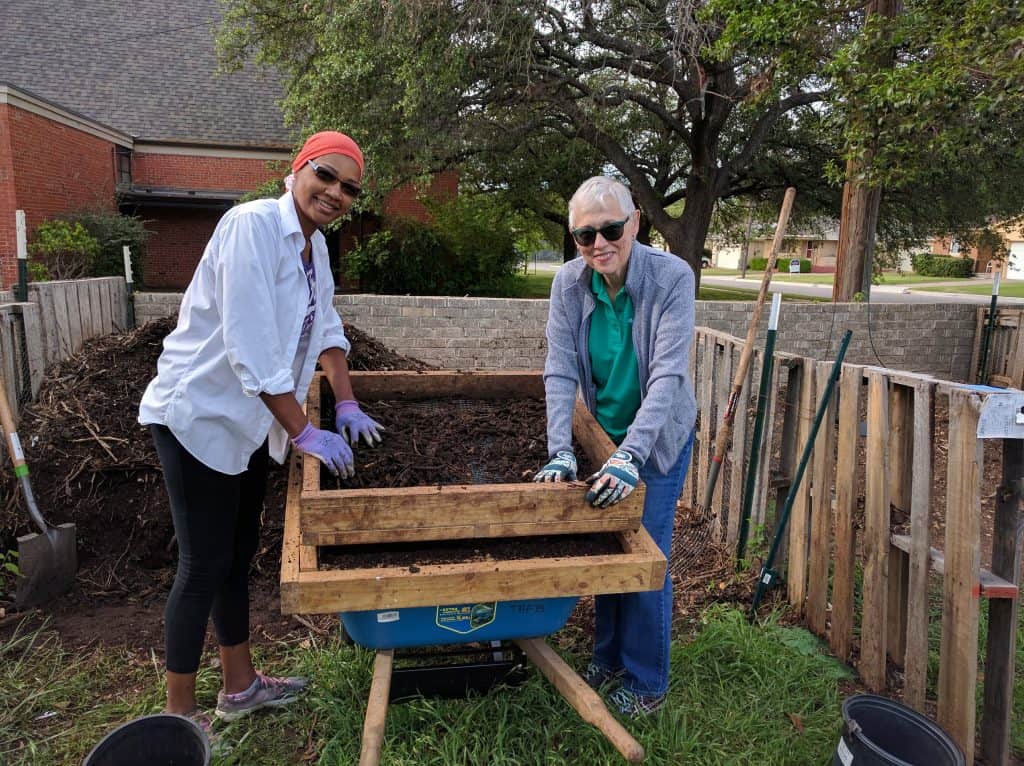
Community Garden
3,000 lbs of fresh produce were harvested from TAFB’s gardens